“Great depression era”
Image extraction: DALL・E2
When the stock market crashed due to the pandemic, I was overwhelmed by the situation of experiencing a pandemic for the first time and couldn’t even consider buying, let alone make tentative selling positions. It’s an embarrassing story.
I reflected that this was because I lacked the basic and important mindset of “mental preparation and action planning” for investment activities, which is to never be in a state of thought paralysis, no matter when or under what circumstances.
From that reflection, I decided to make assumptions for every situation I could think of, which led to the Investment Assumption Series. This time, it’s about the Great Depression.
The Great Depression of 1929
“On October 24, 1929 (Thursday), the New York Stock Exchange saw a massive stock market crash. This event, later to be known as ‘Black Thursday,’ marked the beginning of the Great Depression, an unprecedented economic crisis.”
(Quoted from: https://www.hit-u.ac.jp/hq-mag/research_issues/276_20180308 *in Japanese)
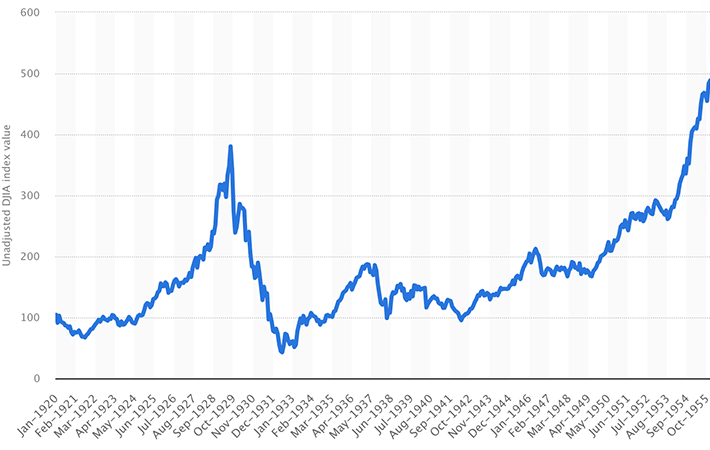
The Dow Jones Industrial Average fell by 89%, and it took 25 years to recover fully, a scale and magnitude of crash that is exceptional in the history of market crashes.
The reasons for this are said to include:
“- Excessive speculation in capital and equipment during the post-war boom of the 1920s led to ‘overproduction’.
– The agriculture sector also faced a depression due to overproduction, leading to falling prices and drastically reduced farm incomes, which in turn lowered domestic effective demand.
– Countries shifted to high tariff policies (protectionism) to protect their own industries, which hindered the expansion of the world market.
– At the same time, the growth of national capital in Asia and the establishment of the Soviet socialist sphere were causing the American market to shrink.
– Companies reduced production, leading to an increase in unemployment, which further reduced purchasing power and led to a vicious cycle of further production cuts.”
(Quoted from: https://www.y-history.net/appendix/wh1504-001.html *in Japanese)
25 Years to Recover to Previous Highs
Personally, what I find incomprehensible is the time it took for the market to fully recover. 25 years…

Monthly values of the Dow Jones Industrial Average (DJIA) from 1920 to 1955
(Reference: www.statista.com)
However, some research suggests that when including stock dividends, the recovery was achieved in about 15 years*. Still, 15 years is a long time.
(*Quoted from: https://www.nikkei.com/article/DGXBZO04570930U0A320C1000000/ *in Japanese)
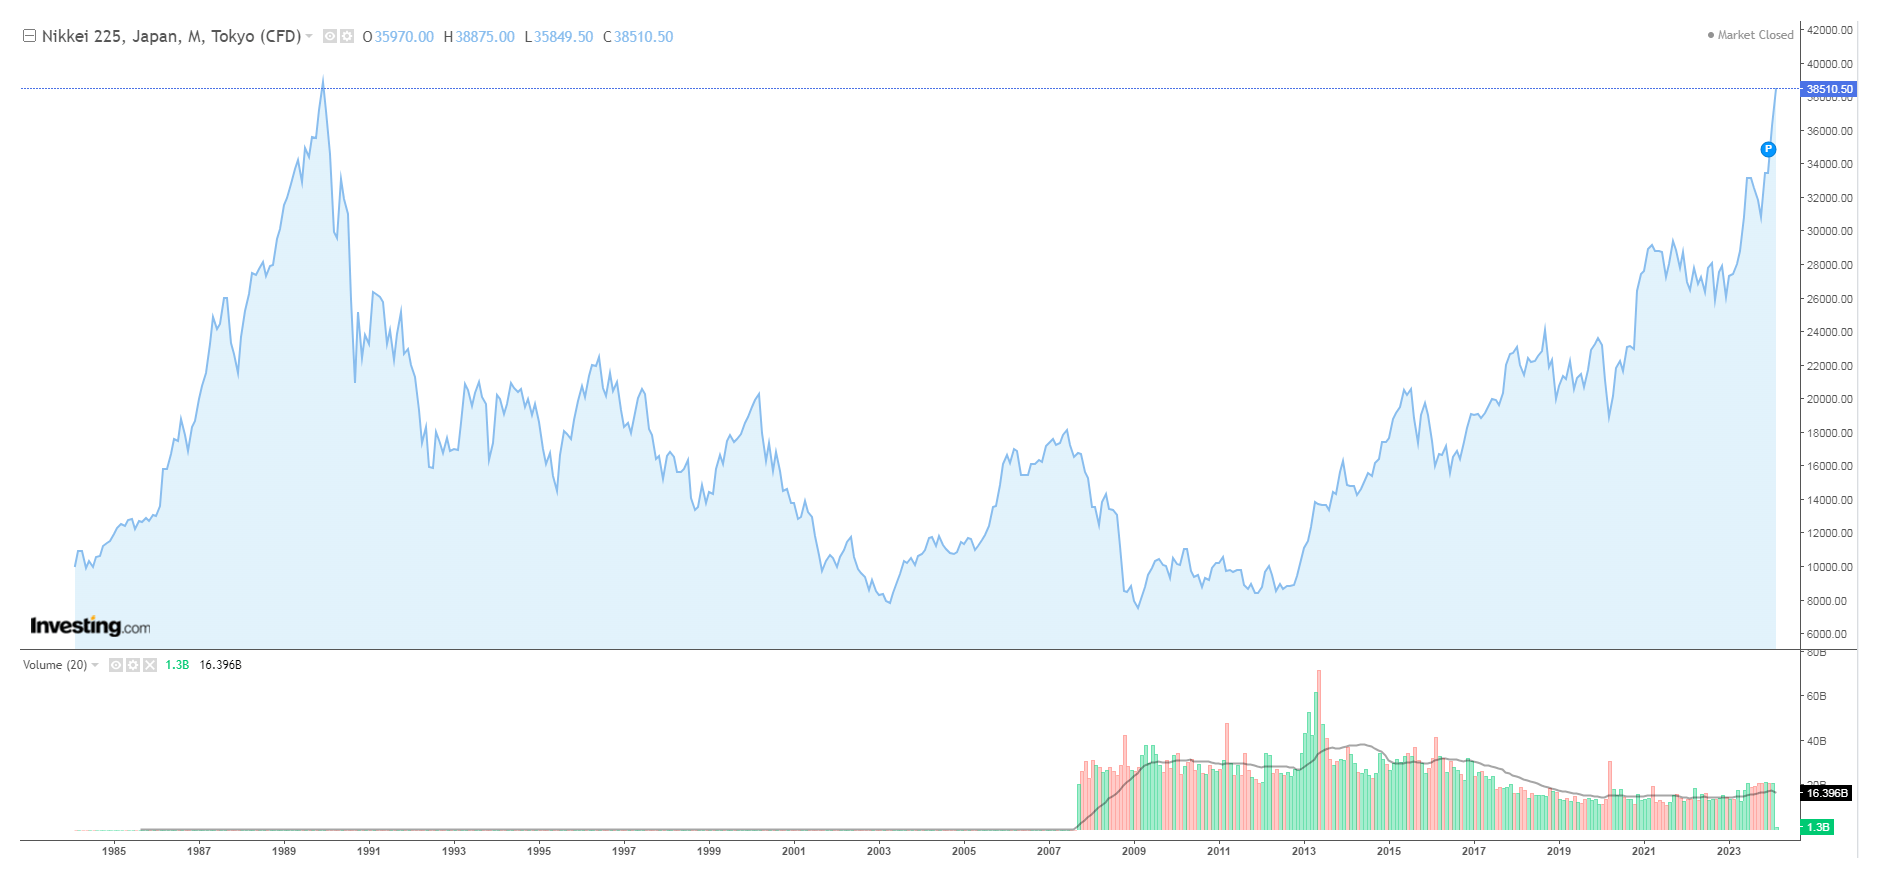
I wondered if there were any other major stock prices that took such a long time to recover, but the answer was closer than I thought. It was the Nikkei 225.
The Nikkei 225 Also Stagnated for Decades
In February 2024, it finally surpassed the 38,915 yen mark of December 29, 1989, for the first time in about 35 years.

(Quoted from: https://www.investing.com/indices/japan-ni225-chart)
For the Nikkei, the major bottom (second bottom) seems to have been around 2009, forming a typical cup-shaped chart. It would be easier to invest if it formed a handle from here.
During the Great Depression, the major bottom seems to be around 1932 to 1933, meaning that the market plunged dramatically over 3 to 4 years from 1929, turning into a complete wasteland, one can imagine.
I have never experienced a nearly 90% decline over several years, and this is just speculation, but market participants might have feared that the market would collapse irreparably. It appears to have that much impact.
However, the overall trend was recovery, as can be seen from the chart. Although it took 25 years to reach a new high, the annual chart suggests an investable environment… but this is just an impression from glancing at the chart nearly a century later.
I was surprised by the market during the Great Depression, as I had imagined a completely dead and calm chart.
Charts are the worst in calm
The charts are the calmest at their worst, with the situation in Japan over the past few decades where approximately 39,000 yen dropped to around 8,000 yen (I have experienced this atmosphere in my own life) also indicating that investment activity was possible even after the bubble burst, from a chart perspective.
However, from 2009 to 2013, if one had invested in the Nikkei, they would have likely been disheartened by the seemingly endless calm market.
As for US stocks, due to concerns about World War II, they dropped by about 40% from Germany’s invasion of Poland in 1939 to 1942, showing fluctuations in almost all periods at least on a monthly basis.
As someone who also does short-term trading, I’m fine as long as there is movement, even if it’s downward. Calmness is the worst, after all.
By the way, I’m not equating the Great Depression with Japan’s bubble burst, but from an investment standpoint, the mood of stagnation lasting for decades after a crash could be considered similar to the investment scenario during the Great Depression, and I think there are some similarities in the charts.
Exchange rates during the Great Depression
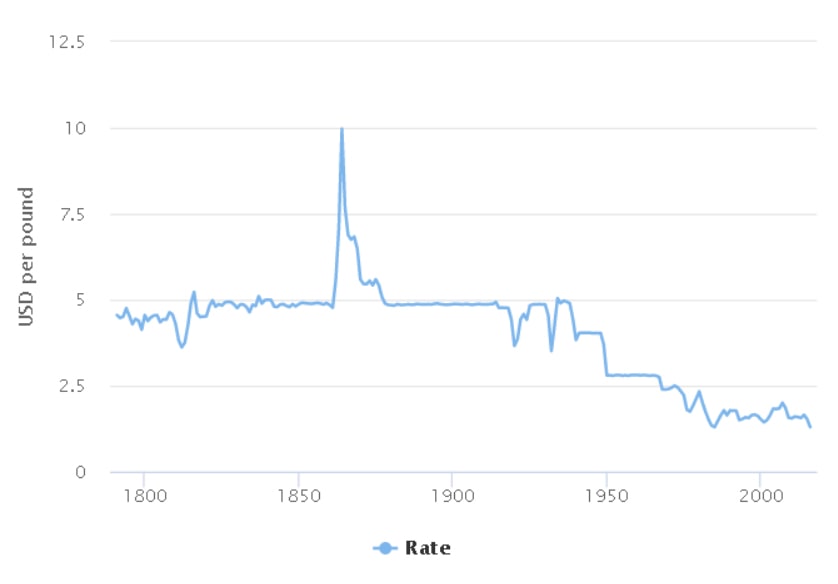
Looking at the US Dollar and British Pound from a historical perspective, it seems the Pound tended to be sold more.
This is also evident when looking at the period after 1929 on this site (https://www.measuringworth.com/datasets/exchangepound/result.php).
The chart seems to represent the decline of the British Empire and the rise of the USA, but it’s unclear whether this was influenced by the Great Depression.
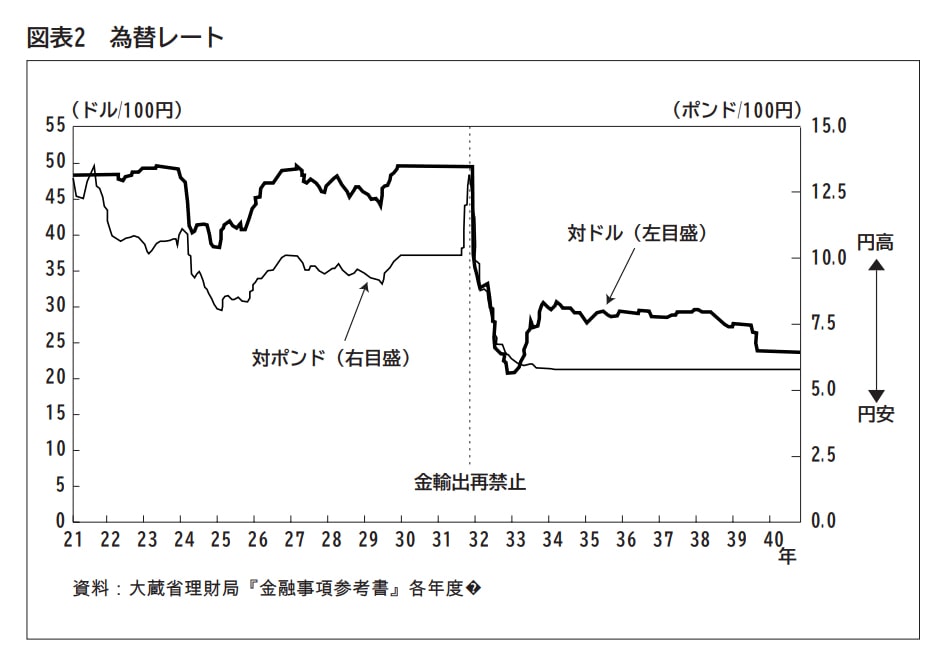
The impact of the panic on the Japanese Yen is also unclear, but the rate fluctuated significantly due to the adoption and abandonment of the gold standard. This was around the time when US stock prices bottomed out during the Great Depression.

(Source: https://www.imes.boj.or.jp/research/papers/japanese/kk21-2-5.pdf *in Japanese)
According to the article, major Western countries, which had suspended the gold standard during World War I, returned to it in mid-1920. Japan returned in January 1930. However, the abandonment of the gold standard by Britain increased the selling pressure on the Yen, and two years after returning to the gold standard, in December 1931, Japan effectively left the gold standard again by prohibiting gold exports. The exchange rate plummeted from the pre-gold standard parity of 49.845 dollars, dropping below 20 dollars by November 1932.
It is clear that the foreign exchange environment 100 years ago is quite different from today, and there are questions about whether it can serve as a reference, but it was worth investigating out of interest.
Safe currencies after 2024 will likely be the US Dollar and Swiss Franc. In this series, we have been examining currency rates during shocks closer to modern times, and the role of the US Dollar and Swiss Franc as safe havens in times of crisis has fundamentally remained unchanged.
The Japanese Yen has fallen from its status as a safe currency in recent years, and particularly in times of crisis, one needs to be cautious about holding too much Yen.
Trading during a Major Crash
I’m not familiar with the investment environment around 1930, and it doesn’t seem necessary for me to understand it, so I’ll think about what actions to take in the current investment environment if there’s a major crash.
Not that there’s much to think about, the actions one can take are limited regardless of the reason for the crash.
First of all, diversify investments not only in stocks but also in commodities and especially government bonds.
In my case, I would change
from
Stocks 4, Commodities/Crypto 3, Bonds/Cash 3
to
Stocks 3, Commodities/Crypto 2, Bonds/Cash 5.
I would sell 10% each of stocks and commodities, and keep that 20% either in cash or buy government bonds with it.
The cash portion would be held in multiple currencies, mainly Swiss Francs, US Dollars, Euros, etc.
If you are doing short-term trading (discretionary trading), place tentative sell orders, with a stop loss of about 20 pips, and once a profit of 20 pips is made, move the stop line to the entry price and leave it. Repeat this process.
No one knows how far a crash will go. However, for US stocks, based on past crash cases, start tentative buying around -30% and look for a serious buying opportunity if it exceeds -50%.
…That’s the investment hypothesis, but needless to say, it doesn’t go smoothly when it comes to actual action, for various reasons.
Unable to Move as Expected
First of all, adjusting the portfolio during a crash means following the big moves. Looking at the chart, the big candlesticks stand out, leaving blanks, and you battle the anxiety of possibly being too late.
Day trading becomes a battle with greed and fear. You start to think maybe it’s okay to break your own rules.
On top of that, you see various information on social media like X or in the news, full of lies and sensationalism.
What improves or overcomes this mental state is “experience”. After all, that’s probably all there is to it. It’s about getting used to it, which is a sorry thing to say, needless to say.
Diversification and Regular Investment
The aforementioned article in Nikkei (https://www.nikkei.com/article/DGXBZO04570930U0A320C1000000/ *in Japanese) also mentioned the profit and loss in case of diversified investment.
According to the article, even during the Great Depression, which took 25 years without dividends and 15 years with dividends to recover, a 50-50 split between stocks and bonds would have recovered the original investment in about 6 years and 2 months.
Moreover, in the case of index investing, the investment returns would have been positive in 3 years and 9 months.
This index investment scenario refers to dollar-cost averaging starting from August 1929 (the peak of the stock prices).
The difference between 25 years and 15 years is significant.
The Great Depression and Bitcoin
While looking at articles and charts about the Great Depression, I felt I had a similar investment experience, which was with Bitcoin.
Of course, in terms of scale and social impact, these cannot be compared, but I clearly remember the euphoria and the subsequent despair during the crash when I started trading BTC around 2017.
And with it, the swarms of scammers and fraudulent investment schemes that emerged. The dizzying number of shitcoins and ICOs.
The feeling of something you bought with hope losing its value at an incredible rate was indescribable.
Summary
During the Great Depression, it’s said that one in four people were unemployed, a 25% unemployment rate. GDP dropped by -15% in three years from 1929. Even those who were employed had their salaries significantly cut.
It’s uncertain if a so-called Great Reset could happen in modern times, but it’s not impossible, so it’s best to be prepared, mentally at least.
Preparation includes:
– Regular diversification and investment.
– Prohibit holding only stocks. Also bonds.
– Keep currencies mainly in US Dollars, Swiss Francs.
– Tentative selling of US stock indexes.
– -30~50% in US stocks is a tentative buying zone.
– Look for a real buying opportunity if it exceeds -50%.
These actions need to consider the possibility of a drop of up to -90%.
And after thinking the stock prices have bottomed out and the market becomes calm and sluggish, it’s normal to think that it’s just how it is. A severely damaged market can take years, multiple years, to recover. But the market will always recover and start moving again. As long as there are humans filled with greed and fear.
Therefore, I strongly agree with the opinion that preparation and patience are the most important elements for an investor. And I believe that one’s skill is truly tested during long periods of stagnation like the Great Depression.
As an example of long-term stagnation, like the recent decades of Nikkei trading where many Japanese individual investors have made billions, I too want to strive for improvement.


