Page Creation Date: 2025.05.12
Last Updated: 2025.05.12
Backtest 016: Daily moving average 9EMA
Environment:
・The daily chart shows a trend
・The weekly 9EMA is sloping in the anticipated direction
Entry:
1. The 9EMA is sloping opposite to the intended direction, price breaks below the 9EMA, and then breaks out in the anticipated direction.
2. The closing price is in the anticipated direction, above/below the EMA.
3. The entry price is set at one tick above the candle that broke through the 9EMA (i.e., the high or low of that candle).
4. Enter the trade when the next candle breaks the entry price.
Exit:
・When an entry condition appears in the opposite direction of the held position
・Or when two consecutive candles entirely close on the opposite side of the 9EMA
Stop Loss:
1. Just below the candlestick that broke the 9EMA.
2. After price moves the same number of pips as the entry candle’s range, move the stop-loss to breakeven.
・The dates and times of the backtesting results are GMT+2.
Note:
・Position sizing needs to be adjusted based on the stop-loss width.
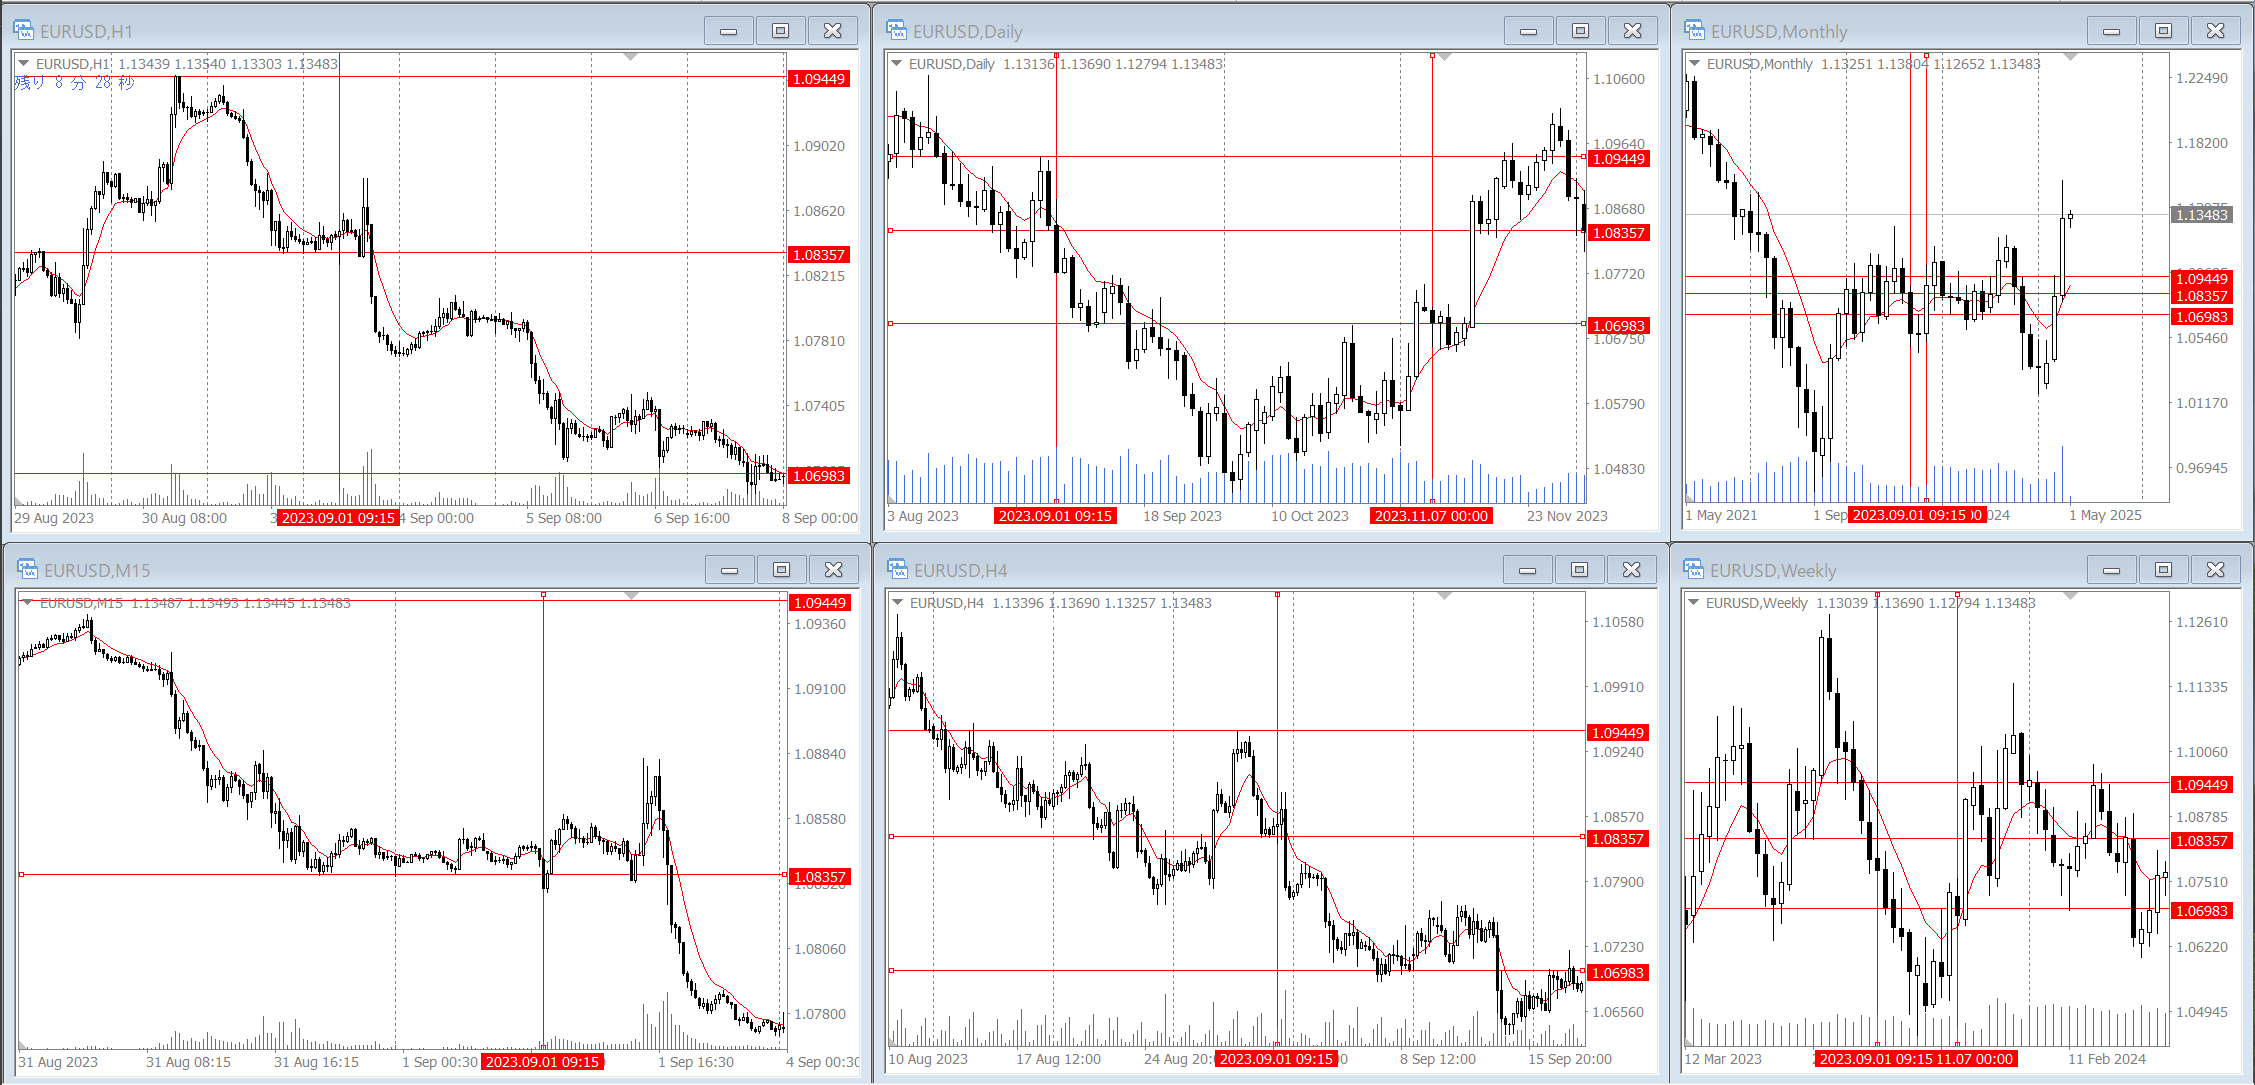
Example: 2023.09.01 09:15 (GMT+2)
Results
Notes:
EUR/USD:
・Usability: YES.
・Profit Factor (PF): 13.13
Gained: 15623.6 pips, Lost: 2489.1 pips, Break-even trades: 47.00% (47/100)、(*2024.12 – 2013.8, approximately 11 years and 5 months)
・Win rate: 30.00% (30/100)
・Trading opportunities: 1.37 times/month。min.: 0 time/month (2024.10 etc) max.: 3 times/month (2019.10 etc)
・Maximum drawdown: 8 times (-210.3 pips、2021.10.26 – 2020.12.28, up to 3 times except for settlement at the open price.)
・This is an adapted version of a method said to be developed by Larry Williams.
・OK to use, but with conditions. Conditions are as follows.
・The win rate is around 30%, with frequent breakeven exits. The issue seems to be in the profit-taking strategy. Often, trades moved several hundred pips into profit but ended at breakeven. In real trading, it’s essential to take partial profit after about 100 pips.
・Stop-losses frequently occur at trend reversal points. Stricter rules using the weekly or even monthly chart are necessary. In other words, correctly identifying trends and ranges using at least the daily chart is crucial for any trading method.
・Since this is a swing trading strategy, stop-losses of up to 300 pips can occur. Without careful position sizing, it can take a mental toll.
・The results include the 9-month EUR/USD crash in 2014, which adds some bias. Therefore, results from 2015 onward are also provided:
Profit: 5675.4 pips, Loss: 1957.2 pips, Breakeven exits: 50.57% (44 out of 87), Win rate: 27.58% (24 out of 87) PF: 2.89