Page Creation Date: 2026.03.04
Last Updated: 2026.03.04
Backtest019 – Daily Flag / Wedge Breakout Trade
Environment:
・Swing trading
・Daily chart only
・Flag/Wedge breakout in the direction of the weekly trend
Entry:
When a daily flag/wedge (pennant) breaks out in the direction of the trend:
・If a recent high (low) is nearby, enter on the breakout.
・If the Bollinger Bands middle line (BB middle) is nearby, enter on breakout in the anticipated direction.
・Adjust position size according to the number of resistance lines (number of daily key levels + 1).
Exit:
・Take partial profits each time price exceeds a daily resistance line
・Close all positions except one at the origin of the flag or pennant
・For the remaining one position, take profit at the daily close where the candle body clearly breaks the support/resistance flip level (for convenience)
Stop Loss:
・Below (above) the most recent support line.
・After reaching the first target, move the stop-loss of the remaining positions to breakeven.
・Verification result timestamps are in GMT+2
Memo:
・Position sizing must be adjusted according to stop-loss width.
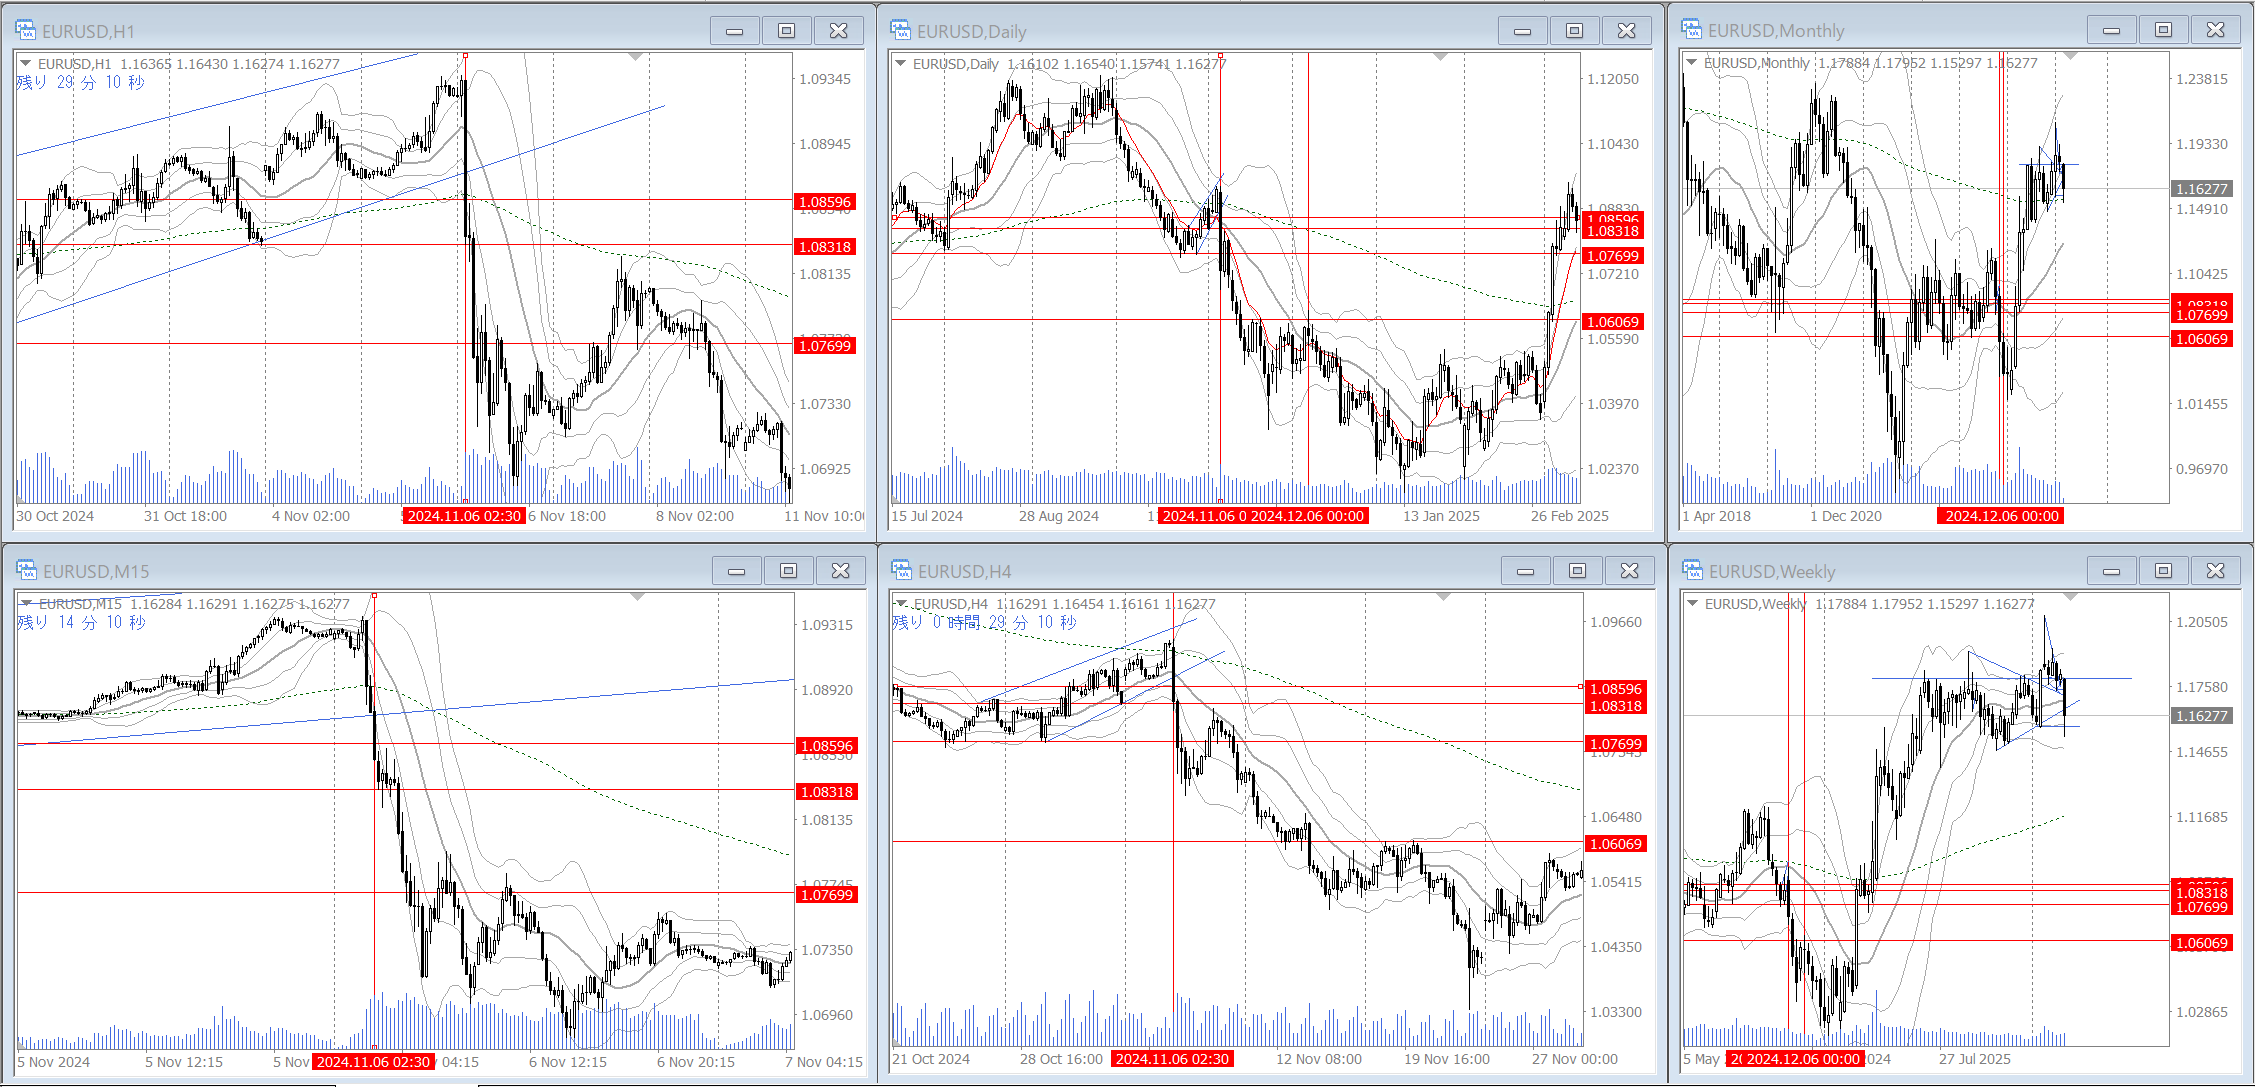
Example: 2024.11.06 (GMT+2)
Results
Notes:
EUR/USD:
・Usable: YES
・Profit Factor (PF): 31.2
・Total profit: 5004.7 pips
・Total loss: 160 pips
・Breakeven exits: 41.00% (41/100), (*2025.05 – 2017.12, approx. 7 years 6 months)
・Win rate: 51.00% (51/100)
・Trade opportunities: 1.11 per month, Minimum: 0/month (e.g., 2025.03), Maximum: 6/month (e.g., 2019.03).
・Maximum drawdown: 3 consecutive losses (-60 pips, 2023.12.26; excluding breakeven trades, maximum 3 consecutive stop-losses)
・An adaptation of Matt Petrallia’s trading method. Judged as usable, but conditional. The conditions are as follows:
Trade opportunities are extremely limited. Getting one opportunity per month is already good, so it is essential to monitor other currency pairs and instruments, and to combine this with other trading strategies.