Page creation date: 2024.03.27
Last updated: 2024.04.30
Backtest 003: Daily Line Break 2-2
Environment:
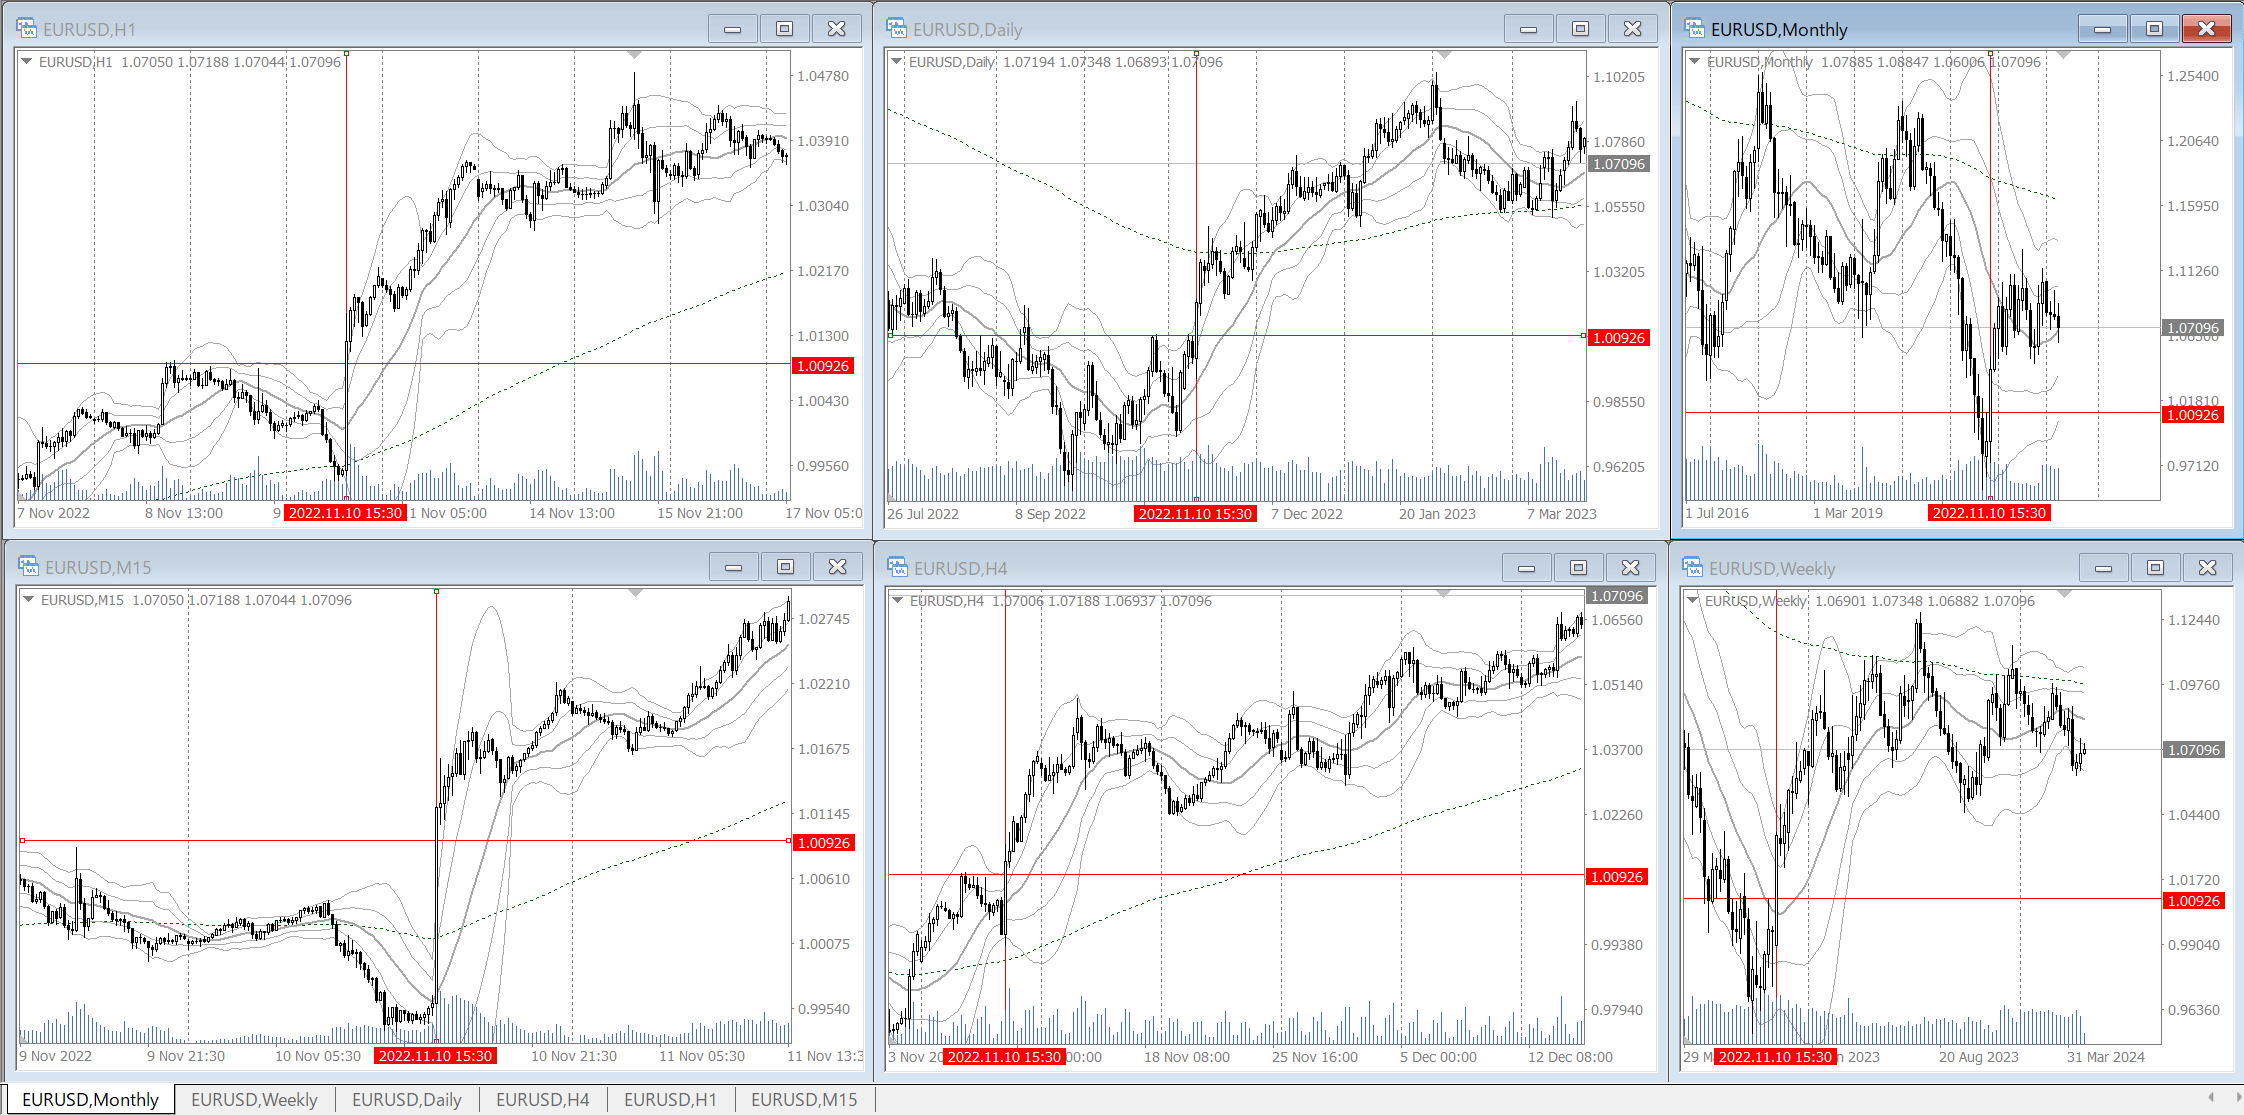
・Daily, 4h, 1h, and 15m charts are all in the Bollinger Bands middle line buying area, or all in the selling area.
・The Bollinger Bands middle line on the daily chart is tilted towards the speculated direction or is moving parallel.
Entry: Break of the most recent high (or low) on the daily chart.
Exit: Cut if the most recent 1h chart support line is broken (trailing stop).
Stop loss: -20 pips / move the stop loss line to the entry price after advancing 20 pips
・The dates and times of the backtesting results are GMT+2.
Notes:
・This is a version with changed exit method for Daily Line Break 2-1 (Backtest 002).
Example: 2022.11.10 15:30 (GMT+2)

Results
Notes:
EUR/USD:
・Usability: OK.
・Profit Factor (PF): 2.98
Gained: 1736.10 pips, Lost: 582.20 pips, Break-even trades: 22.55% (23/102), (*from May 2017 to March 2024, about 7 years)
・Win rate: 51.96% (53/102)
・Trading opportunities: 14.57 times/year. Minimum: 10 times/year (2019, 2022). Maximum: 20 times/year (2023)
・Maximum drawdown: 5 times (-63.4 pips, from 2021.11.10 to 2022.04.25, approximately 6 months, with the longest sequence of 3 break-even trades)
・”Moving the stop to the line after passing the target” was not tested in this verification.


