Page Creation Date: 2024.12.06
Last Updated: 2024.12.06
Backtest 009: 1-Hour Line Break Reversal Trading
Environment:
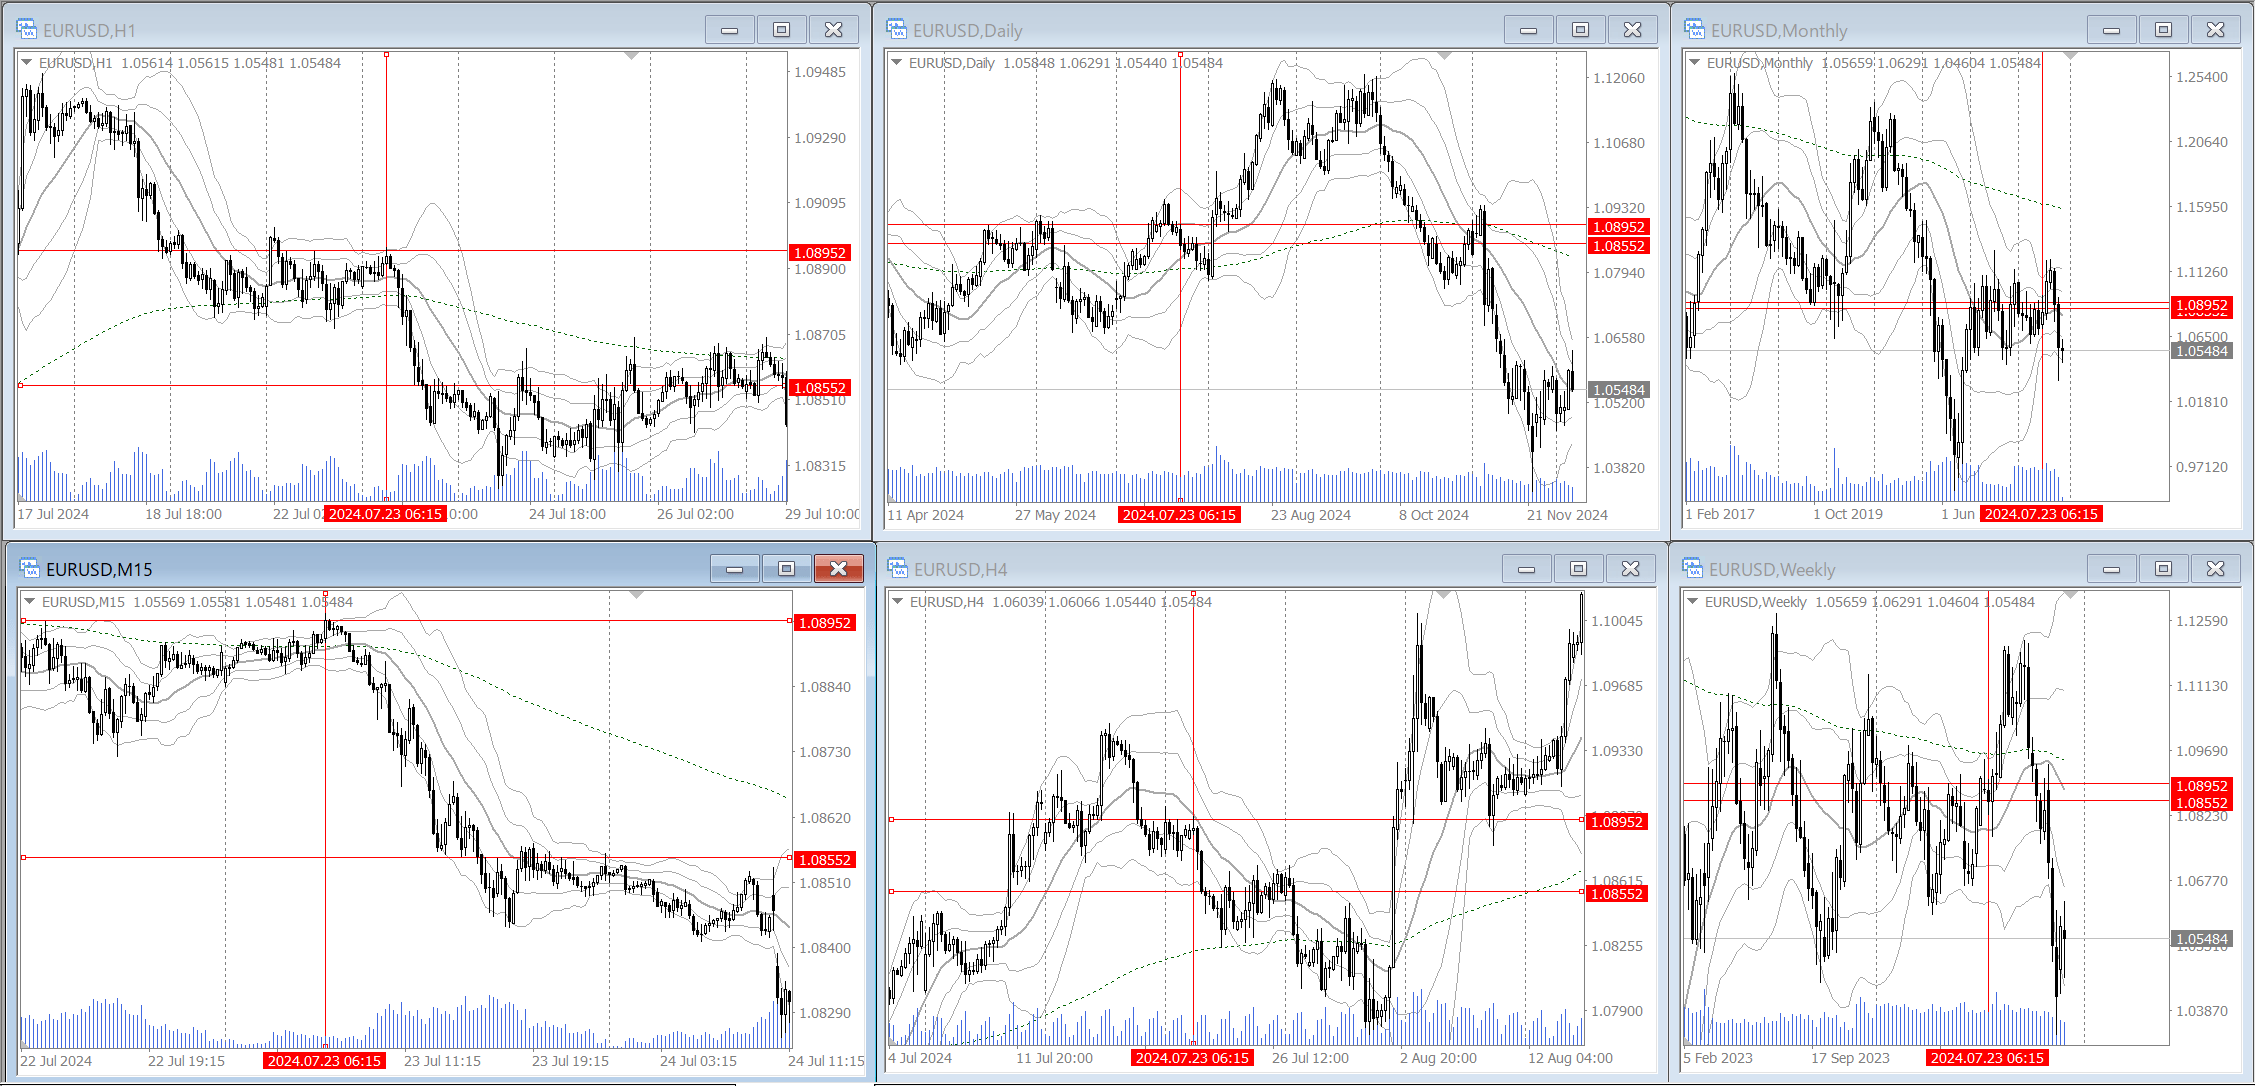
・Use the middle line of the Bollinger Bands on the 4H chart to identify and follow the trend.
Entry: Break of the most recent high (or low) on the 1H chart against the trend.
Exit: Cut at the break of the most recent 15-min support line (trailing stop).
Stop Loss: -20 pips / Move the stop loss line to break-even after advancing 20 pips.
・The dates and times of the backtesting results are GMT+2.
Note:
・Do not exit until the entry point advances 20 pips.
・For the recent high (low) candle used, ensure it is at least about 5 candles away on the 1-hour timeframe, with the basic shape being arch-like.
Example: 2024.07.23 06:15 (GMT+2)

Results
Notes:
EUR/USD:
・Usability: YES.
・Profit Factor (PF): 2.79
Gained: 2234.3 pips, Lost: 800 pips, Break-even trades: 3.12% (4/128)、(*2013.12 – 2024.11, approximately 1 year)
・Win rate: 65.63% (84/128)
・Trading opportunities: 10.06 times/month。min.: 9 time/month (2024.06,08,09) max.: 13 times/month (2024.02,03,11)
・Maximum drawdown: 5 times (-100 pips、2024.11.01 – 2024.11.14, about half a month, up to 5 consecutive stop losses)


